
Amazon Third-Party Seller Origin Countries 2026
As of 2026-09-20. Marketplace Pulse global active-seller share: China 50.03% 1st, United States 18.64% 2nd. Amazon.com top 10,000 (July 2026) China 55.9% of seats.

As of 20 September 2026. Marketplace Pulse’s 25 September 2025 chart of global active-seller share puts China 1st at 50.03%, the United States 2nd at 18.64% and Japan 3rd at 7.64%. The Amazon.com top-10,000 headcount update of 9 July 2026 puts China at 55.9%. Platform revenue: e-commerce platforms. DTC tools: cross-border commerce tools.
Share of global active sellers
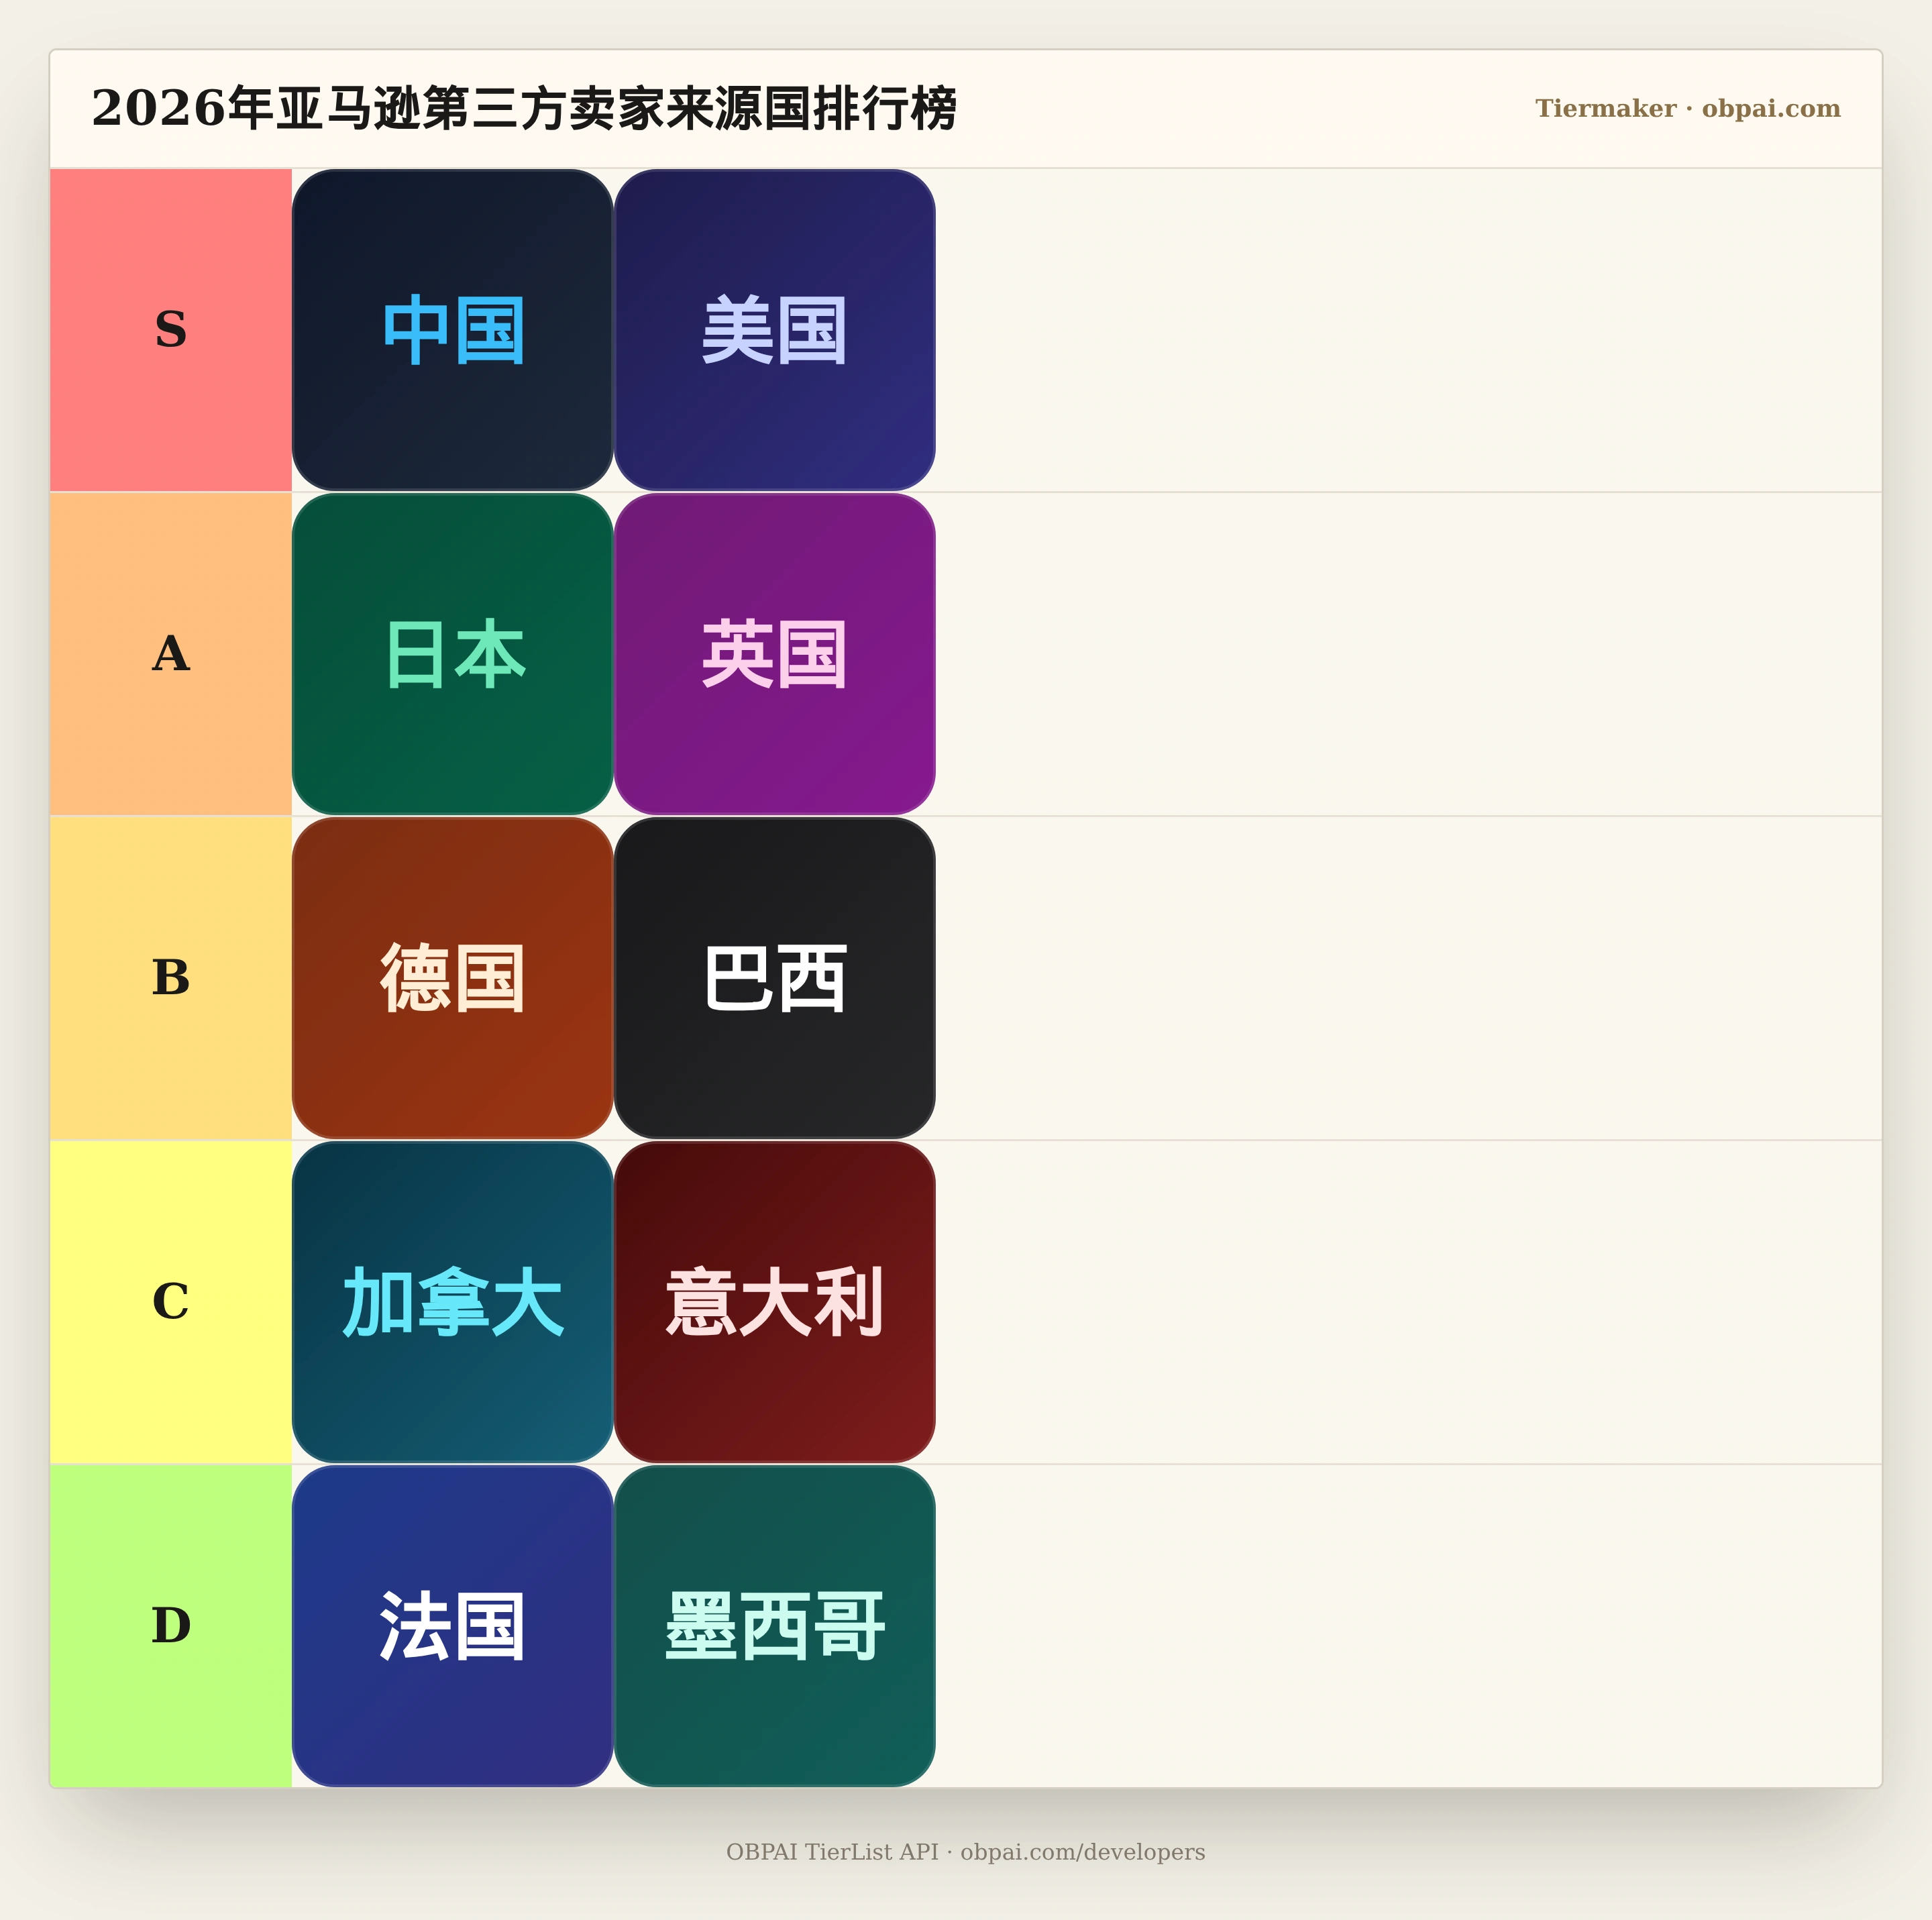
The chart is titled Share of Global Amazon Active Seller Base by Country of Business, top ten by share. Country is the registered business address. Unique businesses only; a seller on several marketplaces counts once. The India and Brazil marketplaces are excluded because of international-seller restrictions; Brazil as an origin still sits 6th. Hong Kong is outside this top ten and is listed separately from mainland China. Marketplace Pulse estimates Amazon.com third-party GMV at about $305 billion: US sellers about $157 billion, Chinese sellers about $132 billion. Average US seller $884,958 versus $393,557 for Chinese sellers. Globally, Chinese sellers take about 39% of third-party revenue.
| # | Origin | Share of global active sellers |
|---|---|---|
| 1 | China | 50.03% |
| 2 | United States | 18.64% |
| 3 | Japan | 7.64% |
| 4 | United Kingdom | 5.9% |
| 5 | Germany | 2.96% |
| 6 | Brazil | 2.77% |
| 7 | Canada | 1.8% |
| 8 | Italy | 1.35% |
| 9 | France | 1.17% |
| 10 | Mexico | 1.12% |
Amazon.com top 10,000 (July 2026)
Marketplace Pulse takes a July snapshot each year. China’s headcount rose from 42.5% in July 2020 to 55.9%; the United States fell from 53.7% to 40.5%. In the same cohort, US sellers hold 65.3% of GMV and Chinese sellers 28.6%. In the top 100, US sellers are 81.4% of seats and 93.2% of GMV. Average selling price is $47.62 for US sellers and $22.03 for Chinese sellers. Headcount share moved another 3.8 points in the past twelve months. China gained 1,342 seats since July 2020; the United States lost 1,320.
| # | Origin | Headcount | GMV of this cohort |
|---|---|---|---|
| 1 | China | 55.9% | 28.6% |
| 2 | United States | 40.5% | 65.3% |
| — | Other | 3.6% | 6.1% |
How this list is ranked
As of 2026-09-20. The main table follows Marketplace Pulse’s global active-seller share chart, article dated 25 September 2025. Unique businesses only; a seller on several marketplaces counts once. The India and Brazil marketplaces are excluded because of international-seller restrictions. The Amazon.com top-10,000 table is the 9 July 2026 update. The Sellers Index covers 67,416 storefronts on the US, UK and France sites only. Amazon’s SMB report has no country split.
| Source | Snapshot | What it prints | Weight |
|---|---|---|---|
| Marketplace Pulse: China Reaches Global Majority on Amazon + in-article chart | Posted 25 Sep 2025; compiled 2026-09-20 | Global active-seller share top 10: China 50.03%, United States 18.64%, Japan 7.64%. 2024 Amazon.com new registrations China 62.3%, US 26.8% | Main |
| Marketplace Pulse: China Won Amazon's Top 10,000 | Posted 9 Jul 2026; July snapshots | Amazon.com top 10,000: China 55.9% of seats (42.5% in July 2020), US 40.5%. Cohort GMV US 65.3%, China 28.6%. Top 100: US 81.4% of seats, 93.2% of GMV | Main (US site) |
| Marketplace Pulse: Japan the Last Marketplace Where Local Sellers Dominate | Posted 3 Apr 2025 | Japan local sellers 54%. US local 34%. Canada local 4%, China-origin 42%, US-origin 12%. 2024 new China registrations: Mexico 68%, US 62%, Japan over 50%, UK 47% | Aux (sites) |
| The Sellers Index: Amazon Sellers by Country 2026 | Jan–Feb 2026; 67,416 storefronts | US, UK and France sites only. Mainland China 69.7%. China-origin 72.1% on the US site, 67.2% UK, 65.7% France | Aux |
| Marketplace Pulse: Top 1.6% of Sellers Drive 50% of Amazon’s 3P GMV | Posted 12 Feb 2026 | ~500,000 active US-marketplace sellers. 7,760 generate half of 3P GMV: US sellers 55% of that cohort and 67% of its GMV; Chinese sellers 41% of the cohort and 30% of GMV | Aux |
| Amazon 2025 Small Business Empowerment Report (aboutamazon 30 Apr 2026) | Posted 30 Apr 2026; figures for 2025 | Independent sellers more than 60% of store sales. 75,000 sellers above $1 million (+36%). US independents averaged over $375,000 in the store. Over 11,000 US-based grew sales 10x. No country split | Aux |
Local sellers by marketplace
Marketplace Pulse, 3 April 2025. Established sites with more than 50,000 sellers and at least one seller feedback in the past year. Japan’s local share is 54%, then the only established marketplace still above half. Germany, Italy, France and Spain are all below 20% local.
| Marketplace | Local | China-origin | US-origin |
|---|---|---|---|
| Japan | 54% | — | — |
| United States | 34% | — | — |
| Canada | 4% | 42% | 12% |
| Germany / Italy / France / Spain | below 20% | — | — |
Among 2024 new registrations from China: Mexico 68%, United States 62%, Japan over 50%, United Kingdom 47%.
| Marketplace | China share of 2024 new registrations |
|---|---|
| Mexico | 68% |
| United States | 62% |
| Japan | over 50% |
| United Kingdom | 47% |
The Sellers Index storefronts (January–February 2026)
67,416 storefronts, US, UK and France sites only. Germany, Spain and Italy are outside this sample. Mainland China is 46,983 storefronts, 69.7%. China-origin share is 72.1% on the US site, 67.2% in the UK and 65.7% in France. Hong Kong is 2,120 storefronts, 3.1%, on its own row.
| # | Origin | Storefronts | Share |
|---|---|---|---|
| 1 | China | 46,983 | 69.7% |
| 2 | United States | 7,886 | 11.7% |
| 3 | United Kingdom | 6,325 | 9.4% |
| 4 | Hong Kong | 2,120 | 3.1% |
| 5 | France | 1,043 | 1.5% |
| 6 | Germany | 331 | 0.5% |
| 7 | South Korea | 246 | 0.4% |
| 8 | Canada | 243 | 0.4% |
| 9 | Vietnam | 194 | 0.3% |
| 10 | Japan | 167 | 0.2% |
| 11 | India | 164 | 0.2% |
| 12 | Spain | 159 | 0.2% |
| 13 | Netherlands | 114 | 0.2% |
| 14 | Australia | 113 | 0.2% |
| 15 | Poland | 107 | 0.2% |
| 16 | Italy | 107 | 0.2% |
| 17 | Taiwan | 92 | 0.1% |
| 18 | Romania | 80 | 0.1% |
| 19 | Singapore | 65 | 0.1% |
The top half of US-marketplace GMV (February 2026)
Marketplace Pulse, 12 February 2026. About 500,000 active sellers on the US site. 7,760 of them generate half of third-party GMV: US sellers are 55% of that cohort and 67% of its GMV; Chinese sellers are 41% of the cohort and 30% of GMV. Each of those 7,760 exceeds $5 million in annual sales.
Amazon’s SMB report (2025)
aboutamazon posted the 2025 Small Business Empowerment Report on 30 April 2026. Independent sellers account for more than 60% of store sales. 75,000 independents surpassed $1 million in sales, up 36% from 2024. US independents averaged more than $375,000 in the store. Over 11,000 US-based sellers grew sales 10x. The report does not split sellers by origin country.
互动体验:拖拽排位《Amazon Seller Origin Countries 2026》
Amazon Seller Origin Countries 2026
想打造自己的个性化天梯图并开放给读者嵌入吗?