
Best Game Consoles of 2026
Apr–Jun 2026 sell-in; lifetime and last fiscal year; S&P CY2026 outlook.
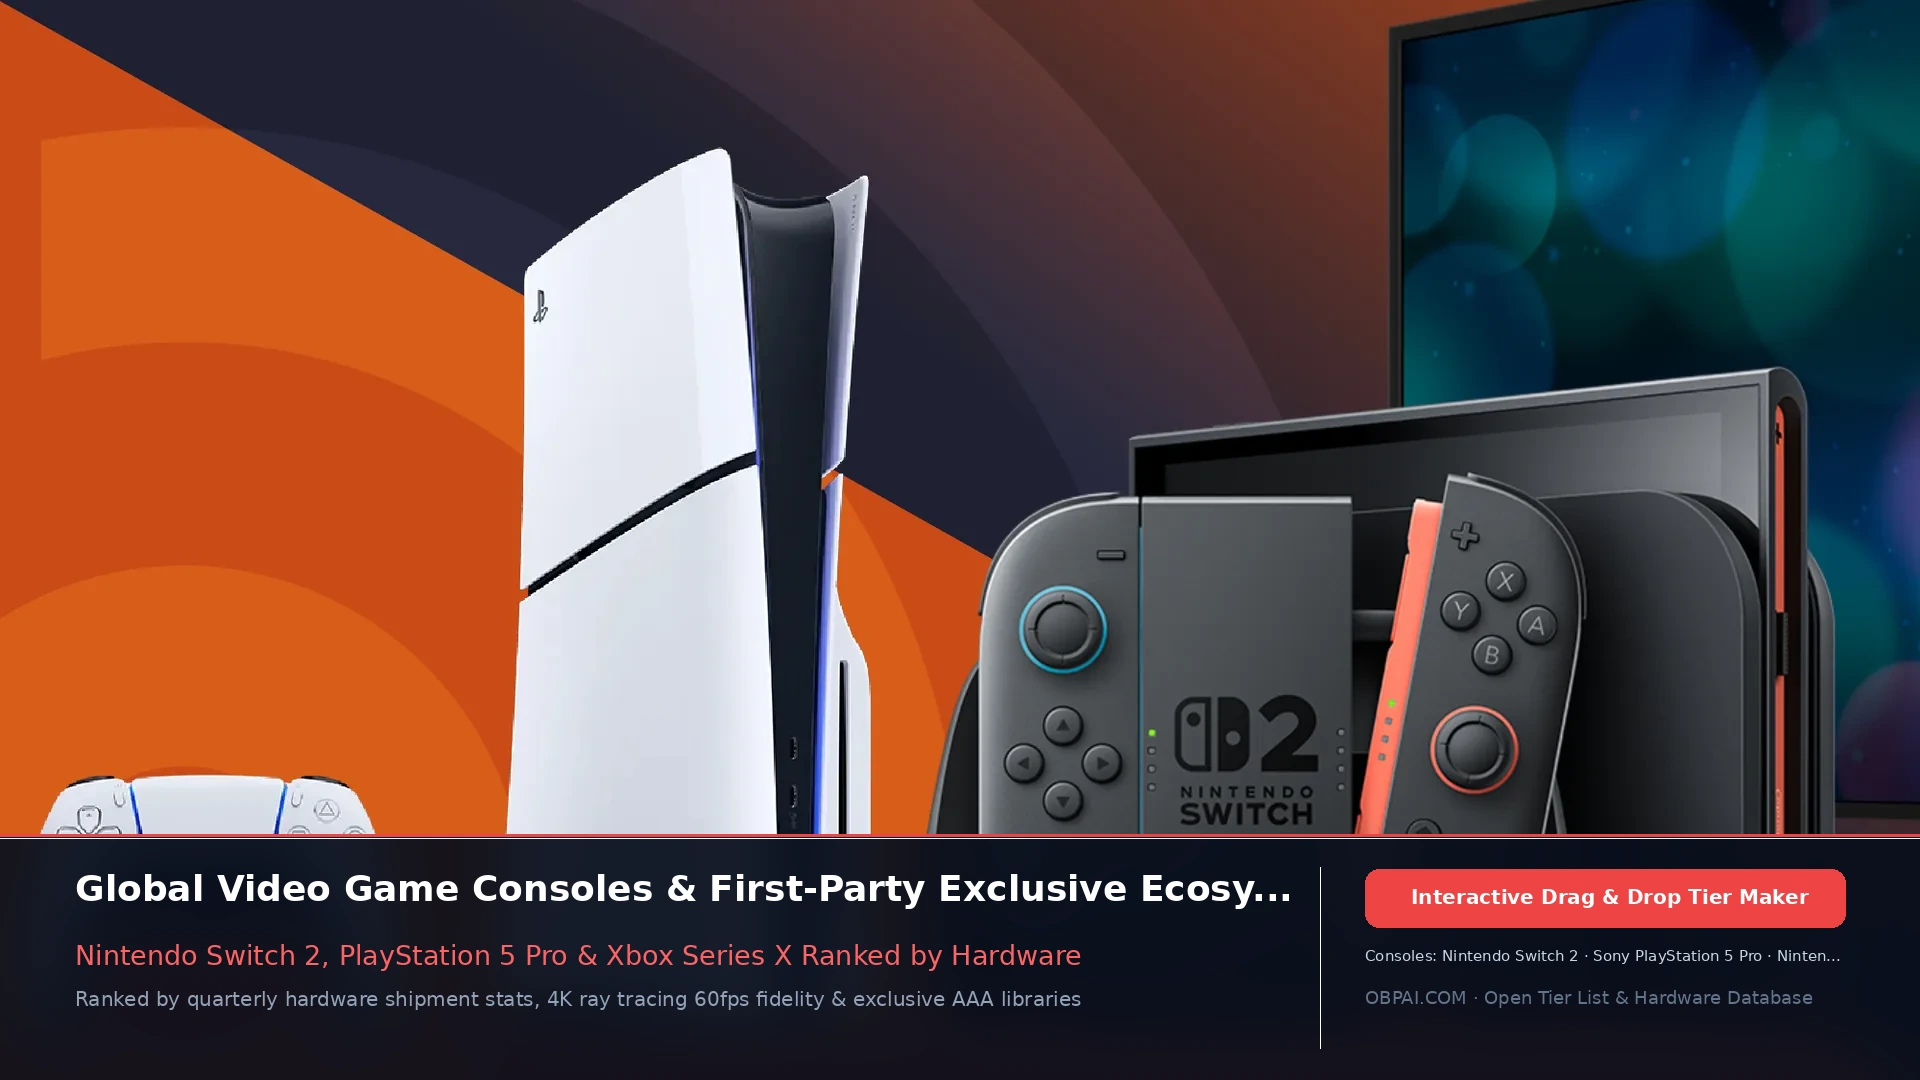
Quarterly sell-in: Apr–Jun 2026
Compiled 2026-08-12. Nintendo FY27 Q1 and Sony FY2026 Q1 both close 30 Jun 2026. Switch 2 3.82M (−34.4% vs launch-quarter 5.82M). PS5 1.6M (−36%). Switch 1 0.66M (−31.8%). Microsoft did not publish Xbox units for the quarter.
| # | Hardware | Quarter | YoY |
|---|---|---|---|
| 1 | Nintendo Switch 2 | 3.82M | −34.4% |
| 2 | PlayStation 5 | 1.6M | −36% |
| 3 | Nintendo Switch (original) | 0.66M | −31.8% |
Lifetime (as of 30 Jun 2026)
| # | Hardware | Lifetime | Source |
|---|---|---|---|
| 1 | Nintendo Switch (original) | 156.59M | Nintendo |
| 2 | PlayStation 5 | More than 95M | SIE; ~95.3M via quarterly delta |
| 3 | Xbox Series X|S | ~35.05M | VGChartz estimate |
| 4 | Nintendo Switch 2 | 23.68M | Nintendo |
Last full fiscal year
Nintendo FY26: Switch 2 19.86M. Sony FY2025: PS5 16.0M. Microsoft FY26: Xbox hardware revenue −29%.
How this ranking is put together
Main table: Apr–Jun 2026 manufacturer sell-in. Lifetime and last fiscal year next. S&P’s calendar-2026 forecast sits after the source table. Logos from TierMaker “Every Major Game Device 2026”. Default rows are S–D. Switch software taste: Switch games.
| Source | Date | What it tracks |
|---|---|---|
| Nintendo FY27 Q1 | Quarter ended 30 Jun 2026 | Switch 2 / Switch sell-in |
| SIE hardware table | As of 30 Jun 2026 | PS5 lifetime and quarterly units |
| Nintendo FY26 | Year ended 31 Mar 2026 | Switch 2 19.86M; FY27 guide 16.5M |
| GamesIndustry / S&P | CY2026 outlook | 33.9M total forecast |
| TierMaker | Synced | 76 console / handheld tiles |
S&P calendar-2026 outlook
S&P / Kagan: 33.9M consoles in 2026 (−19.5% vs 42.1M in 2025). Switch 2 17.1M; PS5 13.2M; Xbox Series 2.5M. Nintendo’s own FY27 Switch 2 guide is 16.5M.
互动体验:拖拽排位《Game Consoles》
Game Consoles
Game Consoles
想打造自己的个性化天梯图并开放给读者嵌入吗?