
Best Chip Foundries of 2026
TrendForce 1Q26 top-10 share; TSMC node mix; 2025 full year and TSMC 2Q26 as side tables.
Q1 main table: top 10 foundries (TrendForce 1Q26)
Compiled 2026-08-12. TrendForce (12 Jun): top 10 combined $47.95B, +3.7% QoQ, another quarterly record. TSMC nearly $35.86B (+6.3%), share 72.3% (70.4% in 4Q25). Samsung Foundry excludes System LSI.
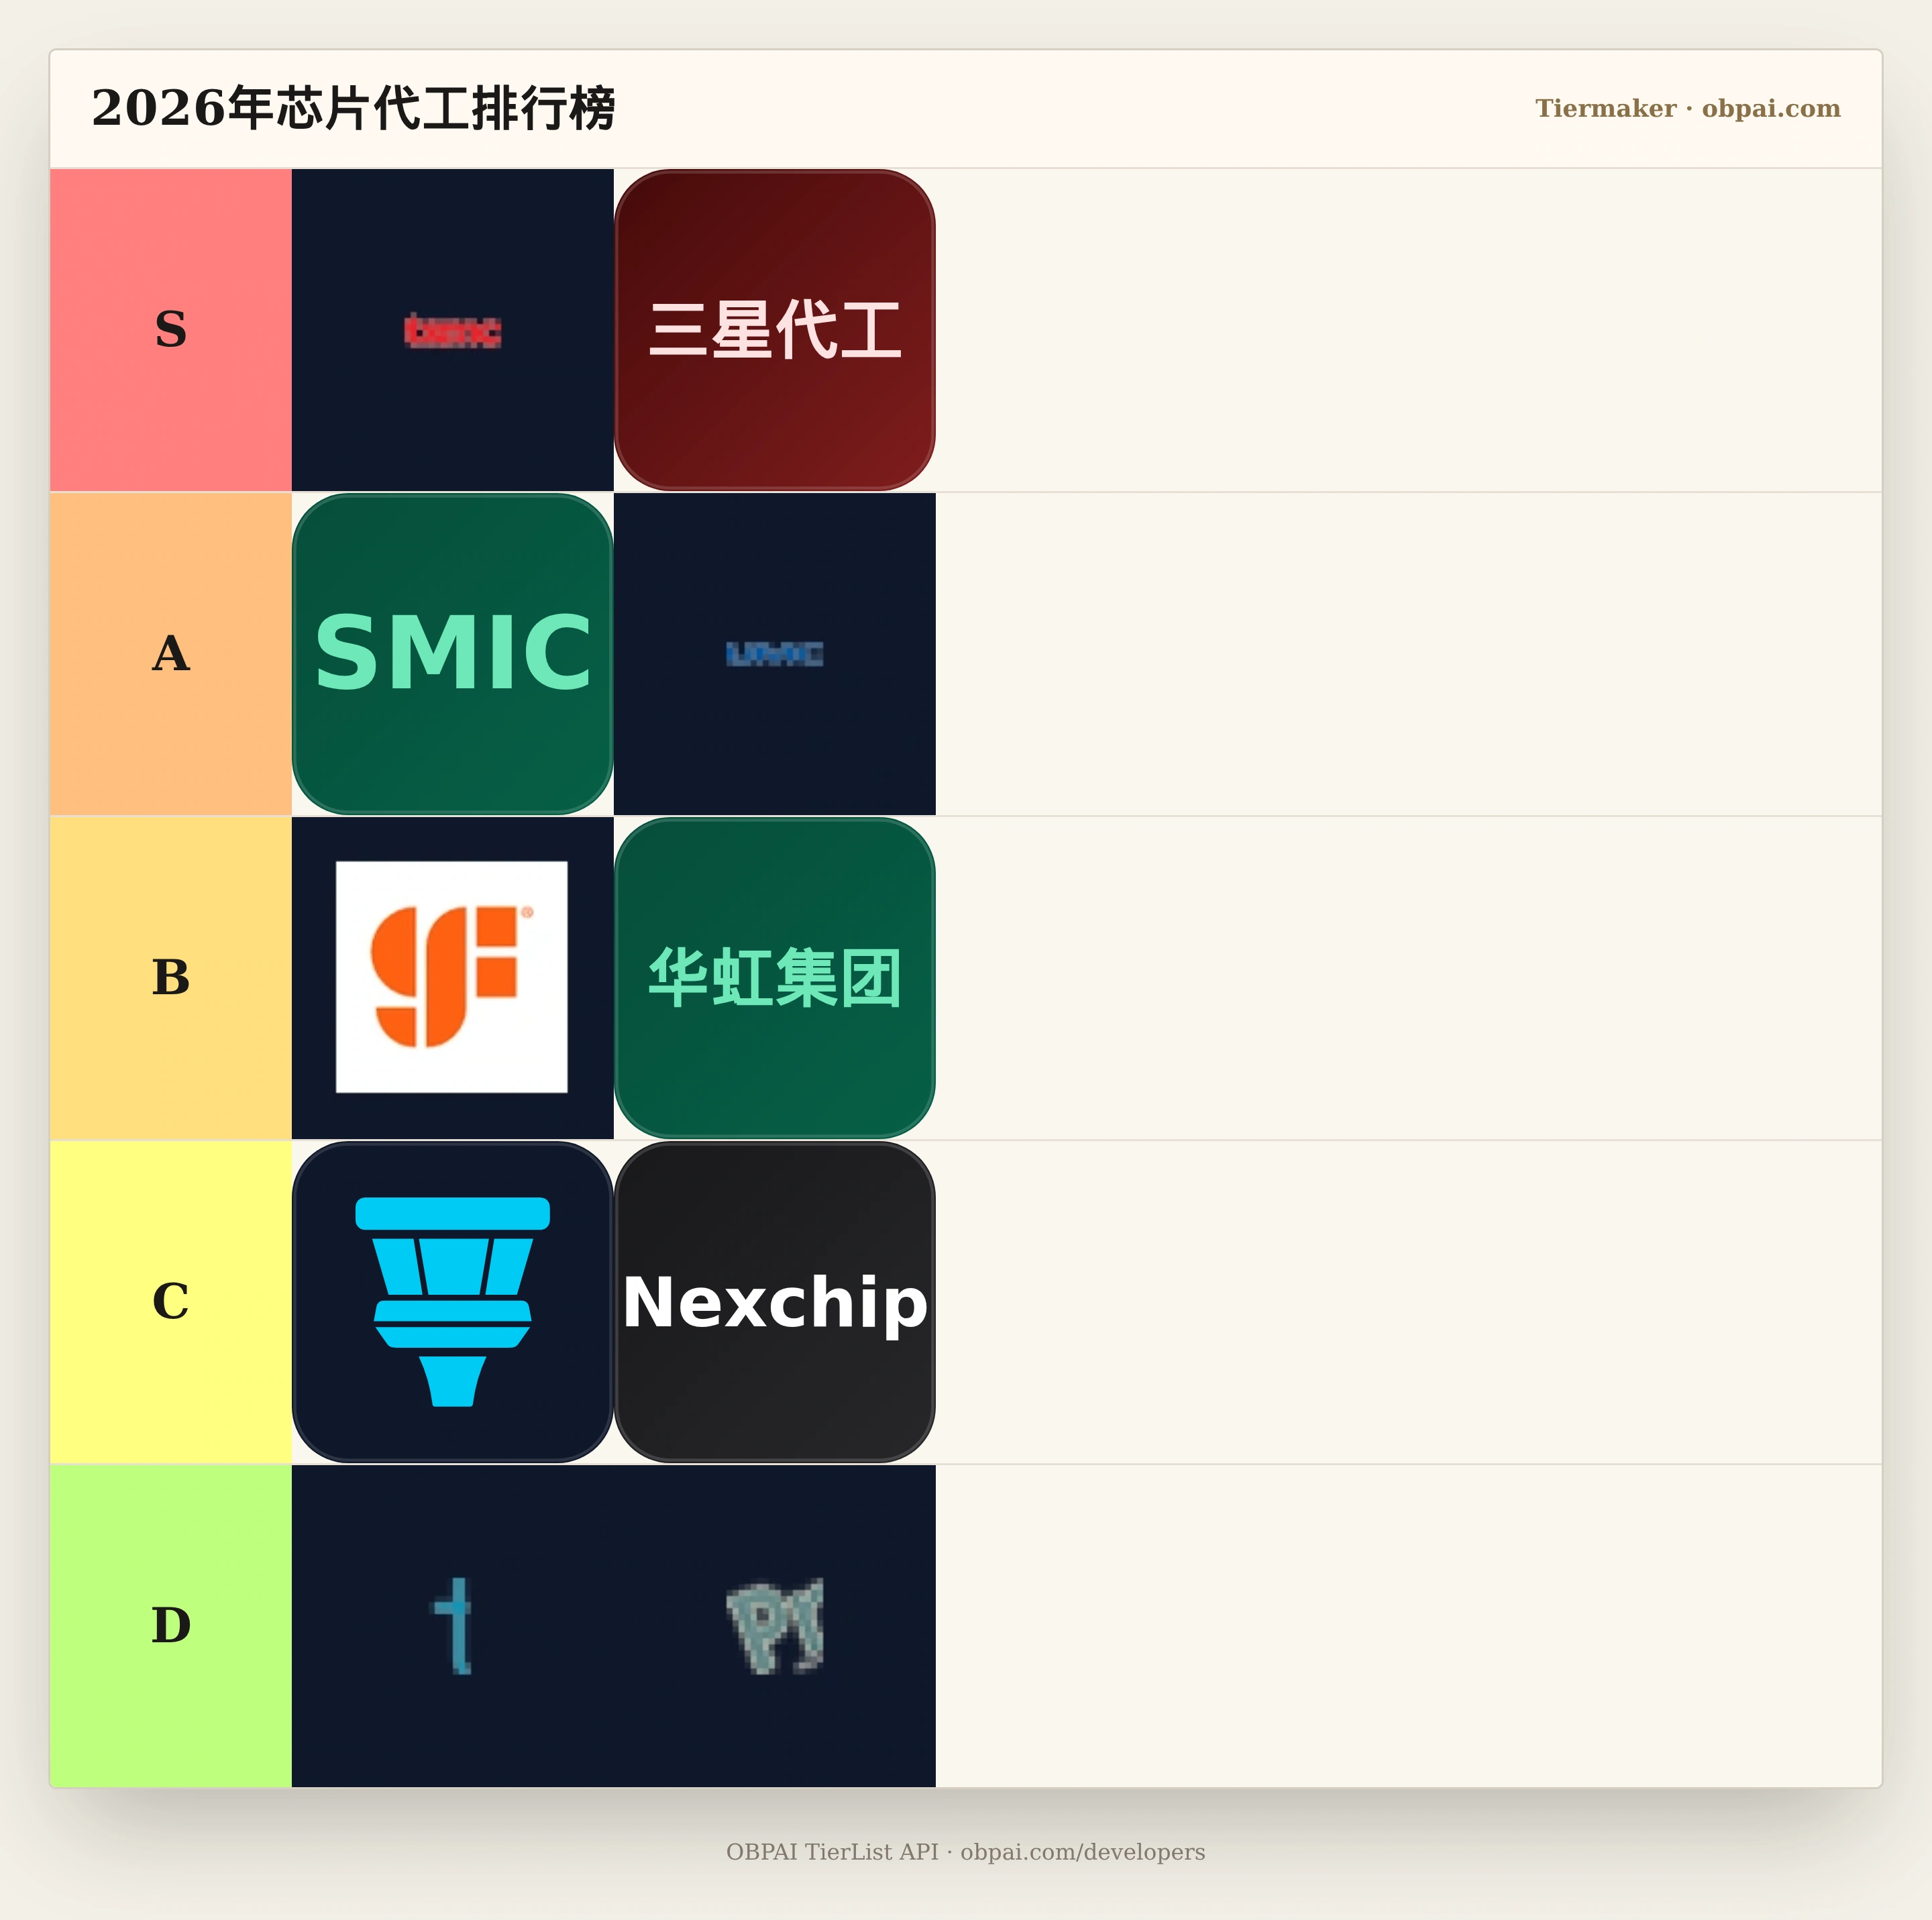
| # | Vendor | 1Q26 revenue | QoQ | 1Q26 share | 4Q25 share |
|---|---|---|---|---|---|
| 1 | TSMC | $35.86B | +6.3% | 72.3% | 70.4% |
| 2 | Samsung Foundry | just over $3.2B | −5.8% | 6.5% | 7.1% |
| 3 | SMIC | $2.51B | +0.6% | 5.1% | 5.2% |
| 4 | UMC | $1.93B | −3.2% | 3.9% | 4.2% |
| 5 | GlobalFoundries | just over $1.63B | ~−11% | 3.3% | 3.8% |
| 6 | HuaHong Group | $1.23B | +1.2% | 2.5% | 2.5% |
| 7 | Tower | $414M | −6% | 0.8% | 0.9% |
| 8 | Nexchip | $400M | +3.2% | 0.8% | 0.8% |
| 9 | VIS | nearly $400M | −2.1% | 0.8% | 0.8% |
| 10 | PSMC | $386M | +4.4% | 0.8% | 0.8% |
Nexchip rose from 9th to 8th, its highest ranking. PSMC’s line is foundry only (memory + logic), excluding own-brand memory.
TSMC wafer revenue by node (1Q26)
From the comparison column in TSMC’s 2Q26 management report.
| Node | Share of wafer revenue |
|---|---|
| 5nm | 36% |
| 3nm | 25% |
| 7nm | 13% |
| 16/20nm | 7% |
| 28nm | 7% |
| 65nm | 4% |
| 40/45nm | 3% |
| ≥0.15μm | 3% |
| 90nm–0.13μm | 2% |
| 2nm | 0% |
7nm and below: 74%. Platforms: HPC 61%; smartphone 26%; IoT 6%; auto 4%.
How this ranking is put together
Main table: TrendForce 1Q26 top-10 revenue and share. Node split: TSMC’s own quarter. Full-year 2025 and TSMC 2Q26 sit after the source table. No usable TierMaker logo pack — name tiles for now. Default rows are S–D.
| Source | Date | What it tracks |
|---|---|---|
| TrendForce 1Q26 | 12 Jun 2026 | Top 10 $47.95B; vendor revenue |
| Semiecosystem on TrendForce | Same quarter | TSMC share 72.3% |
| TrendForce 4Q25 / 2025 | 12 Mar 2026 | Top 10 full year ~$169.5B |
| Evertiq full-year table | Same | Ten-vendor 2025 revenue |
| TSMC 2Q26 earnings | 30 Jun 2026 | $40.20B; node mix |
Full year 2025 (TrendForce)
Top 10 about $169.47B (+26.3%). TSMC $122.54B, 69.9% share (64.4% in 2024).
| # | Vendor | 2025 revenue | YoY | Share |
|---|---|---|---|---|
| 1 | TSMC | $122.543B | +36.1% | 69.9% |
| 2 | Samsung Foundry | $12.634B | −3.9% | 7.2% |
| 3 | SMIC | $9.327B | +16.2% | 5.32% |
| 4 | UMC | $7.629B | +5.5% | 4.35% |
| 5 | GlobalFoundries | $6.791B | +0.6% | 3.87% |
| 6 | HuaHong Group | $4.500B | +25.2% | 2.6% |
| 7 | Tower | $1.566B | +9.1% | 0.89% |
| 8 | VIS | $1.561B | +13.8% | 0.89% |
| 9 | Nexchip | $1.514B | +17.7% | 0.86% |
| 10 | PSMC | $1.404B | +7.7% | 0.80% |
Mid-2026: TSMC Q2
16 Jul: Q2 revenue $40.20B (+12.0% QoQ, +33.7% YoY), NT$1,270.38B. 2nm first appears at 3% of wafer revenue; 3nm 30%; 5nm 33%; 7nm 11%; 7nm and below 77%. HPC 66%; smartphone 22%. North America 78%. Q3 guide $44.6–45.8B.
互动体验:拖拽排位《Chip Foundries》
Chip Foundries
想打造自己的个性化天梯图并开放给读者嵌入吗?