
Big Tech Capex 2026
As of 2026-09-19. Latest completed FY cash capex: Amazon $128.32B 1st, Microsoft $115.95B 2nd, Alphabet $91.45B 3rd.

As of 19 September 2026. The main table uses each filer’s latest completed fiscal year of cash capex in US dollars. Amazon is 1st at $128.32B for calendar 2025, Microsoft 2nd at $115.95B for the year to 30 June 2026, Alphabet 3rd at $91.45B for calendar 2025. ByteDance is private; this page does not guess a number. Cloud share: cloud providers.
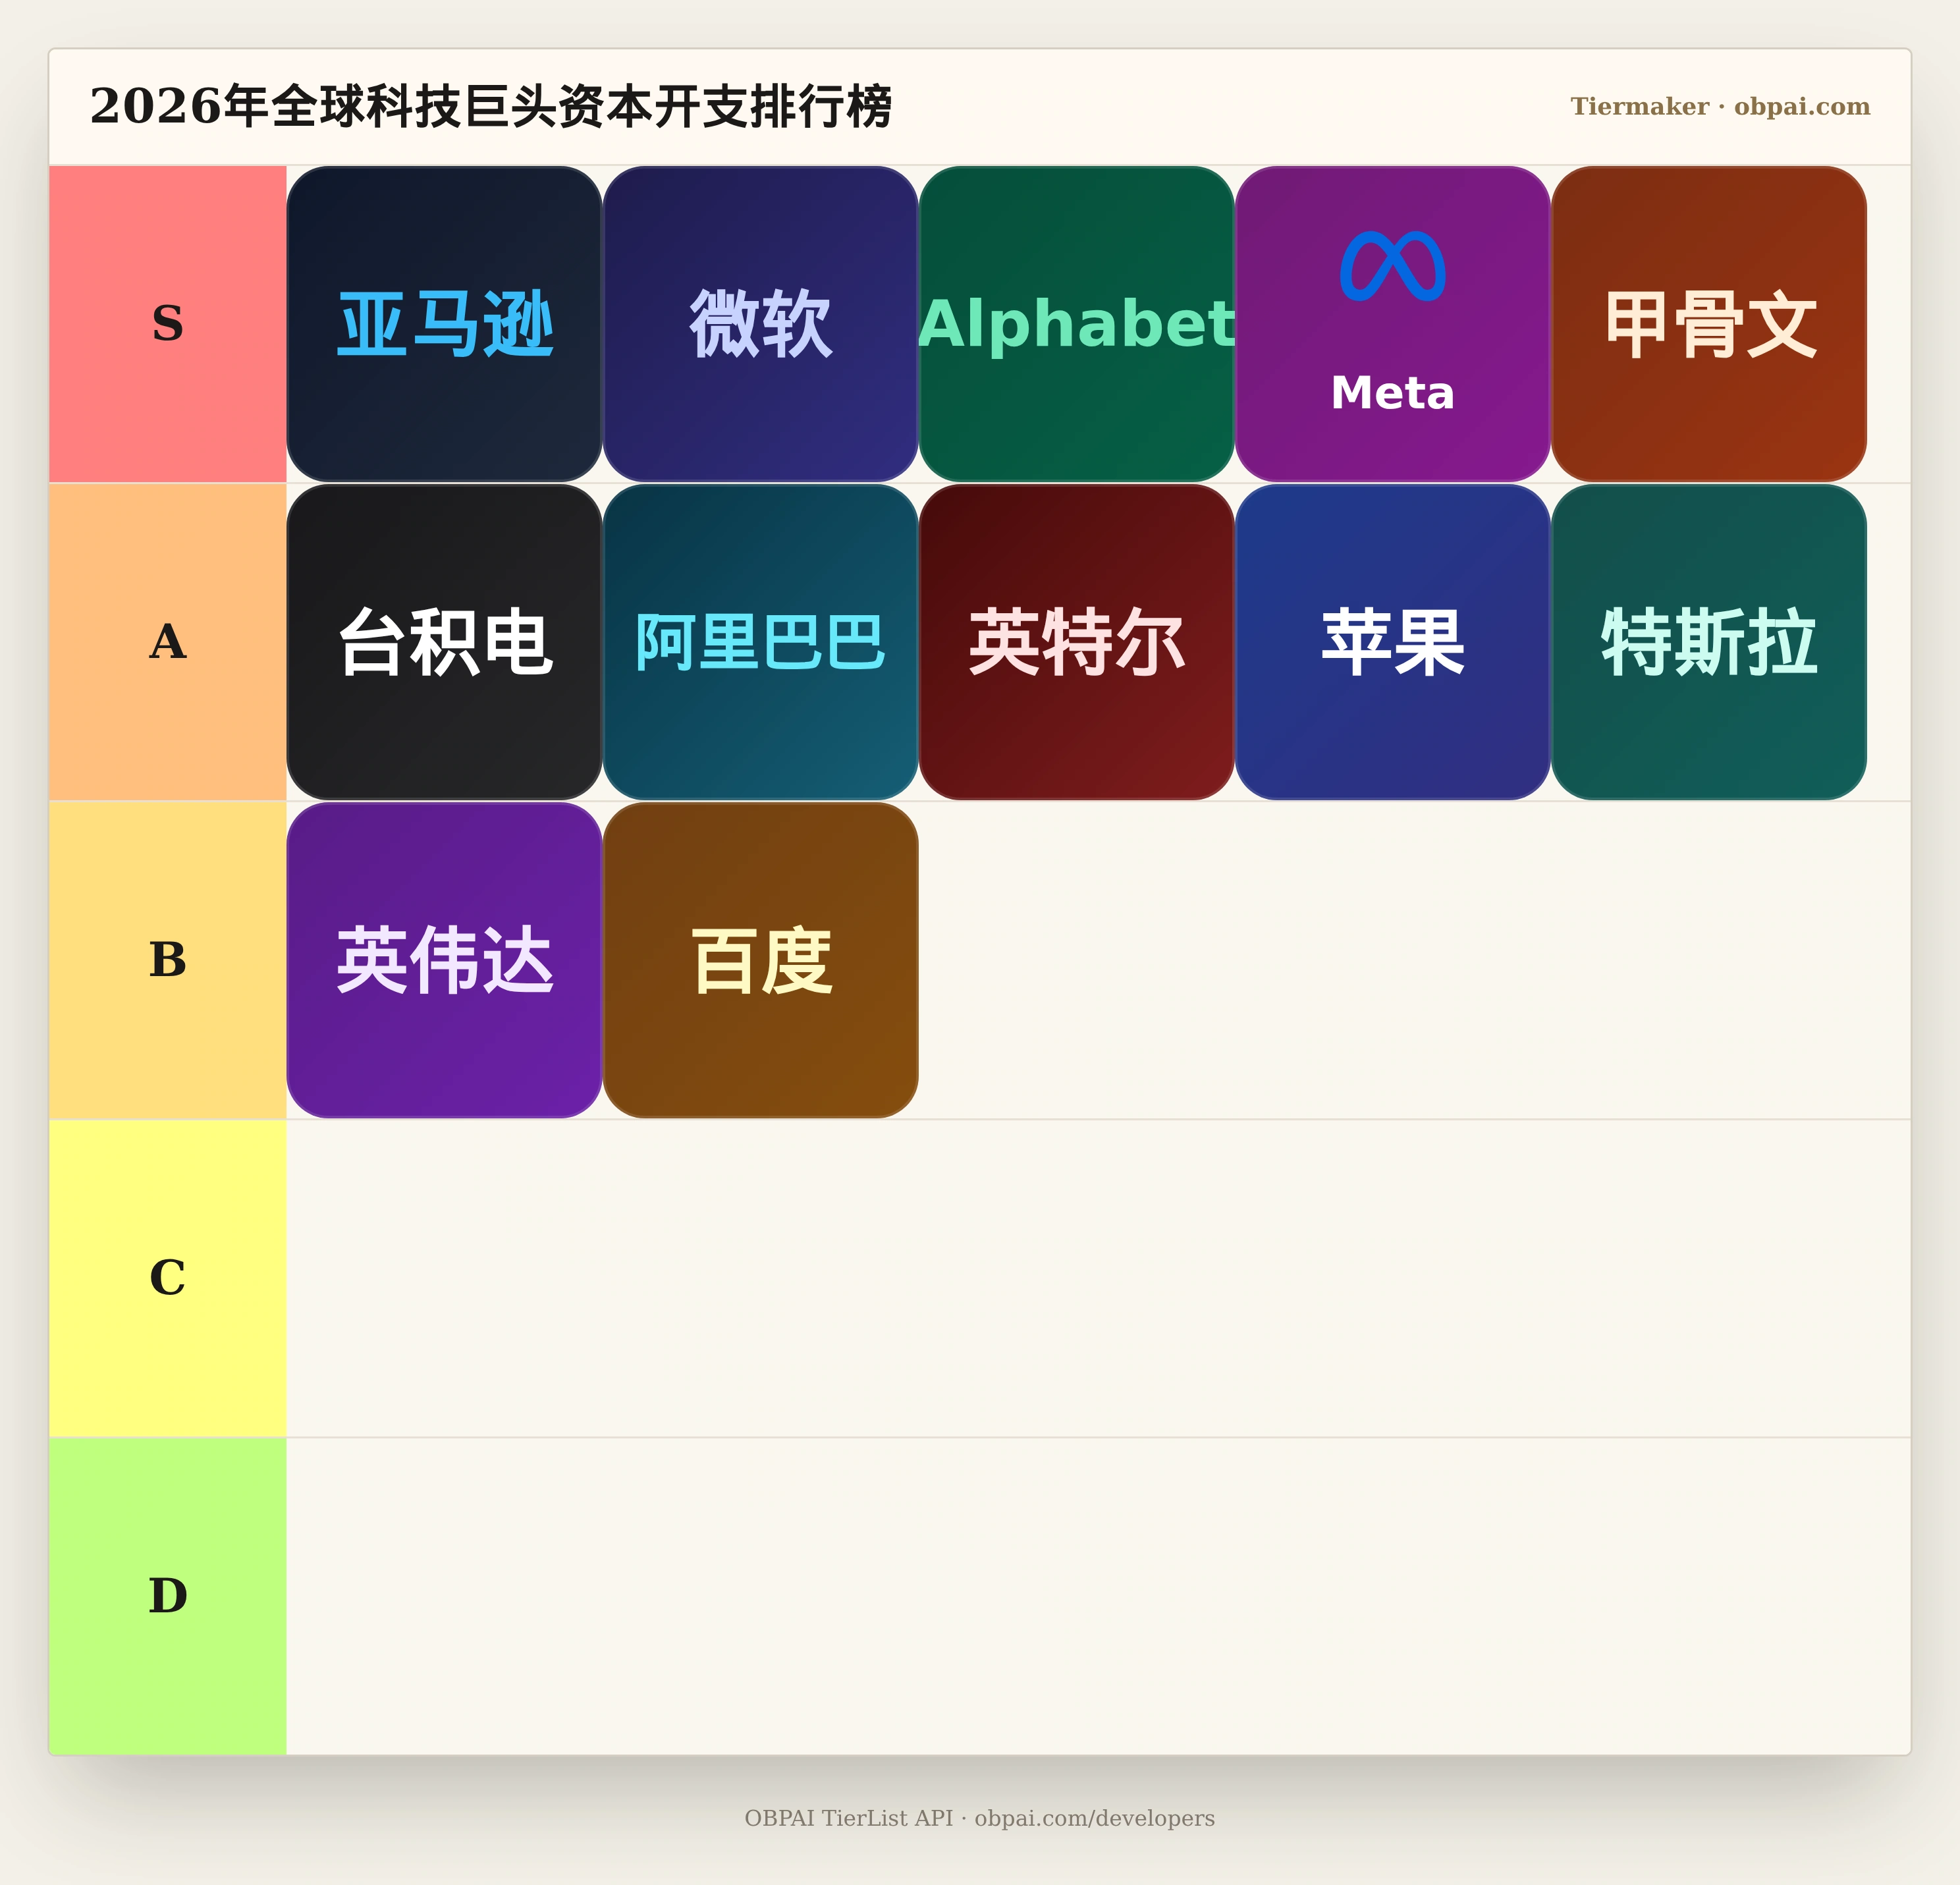
Latest completed fiscal year
TSMC’s headquarters is Taiwan (China). NVIDIA’s line includes purchases tied to intangibles. Meta also prints $72.22B of capex including finance-lease principal; the main table uses the $69.69B purchase line.
| # | Company | Cash capex | Fiscal window |
|---|---|---|---|
| 1 | Amazon | $128.32 B | CY2025 |
| 2 | Microsoft | $115.95 B | FY2026 to 30 Jun 2026 |
| 3 | Alphabet | $91.45 B | CY2025 |
| 4 | Meta | $69.69 B | CY2025 |
| 5 | Oracle | $55.66 B | FY2026 to 31 May 2026 |
| 6 | TSMC | $40.90 B | CY2025 |
| 7 | Alibaba | $18.28 B | FY2026 to 31 Mar 2026 |
| 8 | Intel | $14.65 B | CY2025 |
| 9 | Apple | $12.72 B | FY2025 to 27 Sep 2025 |
| 10 | Tesla | $8.53 B | CY2025 |
| 11 | NVIDIA | $6.04 B | FY2026 to 25 Jan 2026 |
| 12 | Baidu | $1.73 B | CY2025 |
How this list is ranked
As of 2026-09-19. The main table uses each company’s latest completed fiscal year of cash capex in US dollars as the filer printed it. Year-ends differ. ByteDance is private; this page does not guess a number.
| Source | Snapshot | Scope | Weight |
|---|---|---|---|
| Amazon 2025 Form 10-K | year ended 31 Dec 2025 | cash capital expenditures $128.3B (FCF recon $128,320m). Gross purchases $131,819m | Primary |
| Microsoft FY2026 Q4 EX-99.1 | year ended 30 Jun 2026 | additions to property and equipment $(115,948)m vs $(64,551)m prior year | Primary |
| Alphabet 2025 Form 10-K | year ended 31 Dec 2025 | purchases of property and equipment $91,447m | Primary |
| Meta 2025 Form 10-K | year ended 31 Dec 2025 | purchases $69,691m. Company also prints $72.22B capex including finance-lease principal; the main table uses the purchase line | Primary |
| Oracle FY2026 results | year ended 31 May 2026 | capital expenditures $(55,663)m | Primary |
| TSMC 4Q25 Management Report | CY2025 | consolidated capex US$40.90B. HQ Taiwan (China) | Primary |
| Alibaba FY2026 Form 20-F | year ended 31 Mar 2026 | capital expenditures RMB126,063m (US$18,275m) | Primary |
| Intel 2025 Form 10-K | year ended 27 Dec 2025 | additions to PP&E $14,646m | Primary |
| Apple FY2025 Form 10-K | year ended 27 Sep 2025 | payments for PP&E $12,715m | Primary |
| Tesla 2025 Form 10-K | year ended 31 Dec 2025 | capital expenditures $8.53B; cash purchases $8,527m | Primary |
| NVIDIA FY2026 Form 10-K | year ended 25 Jan 2026 | purchases related to PP&E and intangibles $6,042m | Primary |
| Baidu FY2025 results | year ended 31 Dec 2025 | Baidu, Inc. capex RMB12,073m (US$1,726m) | Primary |
| Samsung Electronics FY2025 capex result | posted 29 Jan 2026; window 1 Jan–31 Dec 2025 | about KRW 52.7 trillion. No company USD line, so it stays off the dollar table | Secondary (local currency) |
| Tencent 2025 annual results | year ended 31 Dec 2025 | capex RMB79.2bn / 79,198m. No USD column in the results, so it stays off the dollar table | Secondary (local currency) |
| AP on Amazon Q2 spend | 2026 Q2 call, as reported | Amazon 2026 capex plan $220B (from ~$200B in February). Same story: Alphabet full-year $195B–$205B | Secondary (guidance) |
Won and yuan
Samsung Electronics IR, dated 29 January 2026: about KRW 52.7 trillion of capex from 1 January to 31 December 2025, including KRW 47.5 trillion at Device Solutions and KRW 2.8 trillion at Samsung Display. Tencent’s 2025 capex is RMB 79.2 billion. Neither filing gives a usable USD column, so they stay off the dollar table.
| Company | Capex | Window |
|---|---|---|
| Samsung Electronics | about KRW 52.7 trillion | 1 Jan–31 Dec 2025 |
| Tencent | RMB 79.2 billion | CY2025 |
2026 guidance
AP, from the second-quarter call: Amazon raised its 2026 capex plan to $220 billion, from about $200 billion in February. The same story has Alphabet’s full-year range at $195 billion to $205 billion. Guidance is not a completed year, so it does not move the main-table ranks.
Related
Market cap: largest companies. Profits: most profitable companies.
互动体验:拖拽排位《Big Tech Capex 2026》
Big Tech Capex 2026
想打造自己的个性化天梯图并开放给读者嵌入吗?