
2026 CPU Rankings
CPU Model Rankings: Based on Amazon / Mindfactory retail sales, technical.city and PassMark install base shares; supplemented by Steam vendor data and Mercury shipments.
How this ranking is put together
Compiled on 2026-08-09. This main table is based onspecific models: how much each model sells at retail versus how often it shows up in installed-system samples. Steam’s public survey only breaks down results by vendor and core count, with no SKU-level list, so installed-base figures for models come from technical.city user submissions and PassMark’s share of submissions over the past 90 days. Vendor shipment data still uses Mercury’s quarterly numbers, following the same “shipments + installed base” approach used in theGPU rankingson this site.
| Source | Date | What it tracks |
|---|---|---|
| Amazon US Best Sellers · CPU | Snapshot from 2026-08-09 | Best-seller rank for processors on the US Amazon store (specific models) |
| TweakTown(citing Amazon screenshots) | around June 2026 | The Top 10 models at the time, in order |
| VGTimes / PCGH(Mindfactory) | June 2026 | German DIY channel unit sales by model |
| technical.city Hardware Survey · CPU | August 2026 column | Share of self-reported builds by site users |
| PassMark · CPU Popularity (90 days) | Updated 2026-08-08 | Model share among benchmark submission samples |
| Steam Hardware Survey | July 2026 | Vendor/core count only (no model-level table) |
| HotHardware(Mercury) | Q1 2026 | x86 vendor shipment share |
Top retail sellers: Amazon US (2026-08-09)
On the U.S. site's "Computer CPU Processors" bestseller list that day, nearly all of the top 15 were Ryzen. The #1 spot, a volume seller, went to the Ryzen 5 5500, #2 was the gaming-focused Ryzen 7 9800X3D, and #3 was the previous-gen gaming favorite Ryzen 7 7800X3D. Intel's highest entry was #15: theCore Ultra 7 270K Plus。
| # | Model | Notes |
|---|---|---|
| 1 | AMD Ryzen 5 5500 | AM4 / DDR4 entry-level six-core |
| 2 | AMD Ryzen 7 9800X3D | Zen 5 X3D, 8-core |
| 3 | AMD Ryzen 7 7800X3D | Zen 4 X3D, 8-core |
| 4 | AMD Ryzen 5 9600X | Zen 5 mainstream, 6-core |
| 5 | AMD Ryzen 7 5800X3D | AM4 X3D, including the anniversary re-release |
| 6 | AMD Ryzen 9 9950X3D | Zen 5 flagship X3D |
| 7 | AMD Ryzen 7 7700X | Zen 4, 8-core |
| 8 | AMD Ryzen 5 7600X | Zen 4, 6-core |
| 9 | AMD Ryzen 7 9700X | Zen 5, 8-core, non-X3D |
| 10 | AMD Ryzen 5 5600X | AM4 six-core |
| 11 | AMD Ryzen 9 5900XT | AM4 16-core refresh |
| 12 | AMD Ryzen 7 5800XT | AM4 eight-core refresh |
| 13 | AMD Ryzen 9 9950X | Zen 5 flagship without 3D V-Cache |
| 14 | AMD Ryzen 7 9850X3D | Successor to the 9800X3D |
| 15 | Intel Core Ultra 7 270K Plus | Highest-ranked Intel on the list |
When TweakTown relayed an earlier Amazon screenshot, the order was 9800X3D → 5500 → 9600X → 7800X3D → 5800XT → 9950X3D → 5900XT → 7600X → 5600 → 7700X; rankings shift with promotions and stock, but the top models overlap heavily.
Channel sales by model: Mindfactory, June 2026
Germany's major DIY retailer Mindfactory sold roughly 6595 CPUs that month (AMD about 5,990 / 90.83%, Intel about 605 / 9.17%). Models with 3D V-Cache accounted for about 64.7%The top single model was Ryzen 7 9800X3D: roughly 1880 units, accounting for about 28.5%。
| # | model | Sales (approx.) | Share of monthly CPU |
|---|---|---|---|
| 1 | Ryzen 7 9800X3D | 1880 | ~28.5% |
| 2 | Ryzen 7 5800X3D (10th Anniversary) | 830 | ~12.6% |
| 3 | Ryzen 7 7800X3D | 470 | ~7.1% |
| 4 | Ryzen 9 9950X3D | 420 | ~6.4% |
| 5 | Ryzen 7 9850X3D | 400 | ~6.1% |
| — | Intel's top pick that month: Core Ultra 7 270K Plus | 115 | ~1.7% |
The May round (PCGH / TechEpiphany) also had the 9800X3D in first place (~810 units / 28.6%), followed by the 7800X3D, 9850X3D, 9950X3D, and 9600X. A single European store's numbers don't extrapolate to global shipments, but for what DIY builders are actually putting in their rigs, this table is the most concrete look available.
Build share by CPU model: technical.city (August 2026)
Steam doesn't publish "what percentage of users run which CPU." technical.city's CPU table is based on self-reported configurations from site visitors—a smaller sample than Steam's, but it lists full model names. Here's the top 15 as of August 2026:
| # | Model | August share | July |
|---|---|---|---|
| 1 | Ryzen 5 5500 | 3.46% | 3.46% |
| 2 | Ryzen Threadripper PRO 9995WX | 2.63% | 2.19% |
| 3 | Ryzen 5 5600 | 2.34% | 2.26% |
| 4 | Ryzen 7 5700X | 1.81% | 1.45% |
| 5 | Core i5-12400F | 1.79% | 1.98% |
| 6 | Ryzen 5 7500F | 1.62% | 1.68% |
| 7 | Core i5-12450H | 1.57% | 1.58% |
| 8 | Core i3-12100F | 1.49% | 1.76% |
| 9 | Ryzen 5 3600 | 1.33% | 1.37% |
| 10 | Core i5-13420H | 1.22% | 1.06% |
| 11 | Ryzen 5 5600X | 1.11% | 0.84% |
| 12 | Ryzen 7 9800X3D | 1.08% | 0.54% |
| 13 | Ryzen 9 9950X3D | 1.07% | 1.07% |
| 14 | Ryzen 7 7800X3D | 1.03% | 1.23% |
| 15 | Core i5-10400F | 0.95% | 0.99% |
In the installed base, cheap AM4 six-cores (5500 / 5600) and the H-series chips from older laptops still rank high; the 9800X3D jumped from roughly 0.54% in July to about 1.08% in August. The Threadripper PRO 9995WX sits at No. 2, which reflects the site’s sample leaning toward high-end and workstation builds—not the same crowd as Amazon’s retail bestsellers.
PassMark, last 90 days: popular models by benchmark submissions
PassMark Based on benchmark submission volume over the last 90 days as a proxy for “relative popularity,” updated as of 2026-08-08. The top entries:
| # | Model | Sample share (approx.) |
|---|---|---|
| 1 | Ryzen 7 9800X3D | 2.0% |
| 2 | Ryzen 7 7800X3D | 1.7% |
| 3 | Ryzen 5 5500 | 1.5% |
| 4 | Ryzen 7 5700X | 1.3% |
| 5 | Ryzen 5 5600X | 1.2% |
| 6 | Ryzen 5 9600X | 1.1% |
| 7 | Core i5-1135G7 | 1.1% |
| 8 | Ryzen 9 9950X3D | 1.0% |
| 9 | Ryzen 5 3600 | 1.0% |
| 10 | Core i5-12400F | 0.9% |
Whoever likes chasing benchmark scores ends up in that sample, which doesn't overlap with full-system shipments or the Steam player pool; when cross-checking against Amazon and Mindfactory, the 9800X3D, 7800X3D, and 5500 still keep showing up.
Steam, July 2026: Only vendor and core counts
Windows: GenuineIntel roughly 54.65%, AuthenticAMD roughly 45.34%. The combined view "8 cpus" sits around 27.85%, slightly above "6 cpus" at about 27.52%; on Windows alone, six-core still holds about 28.43% and eight-core about 27.74%. On the Linux side, AMD accounts for roughly 67.21% (including Steam Deck and similar devices).
Vendor shipments (Mercury 2026 Q1, supplemental table)
x86 overall: AMD roughly 32.6%, Intel roughly 67.4%. Desktop about 66.8% / 33.2%, notebook about 71.7% / 28.3%, server (ex-IoT) about 66.8% / 33.2%. These are chip shipment shares, not tied to specific SKUs.
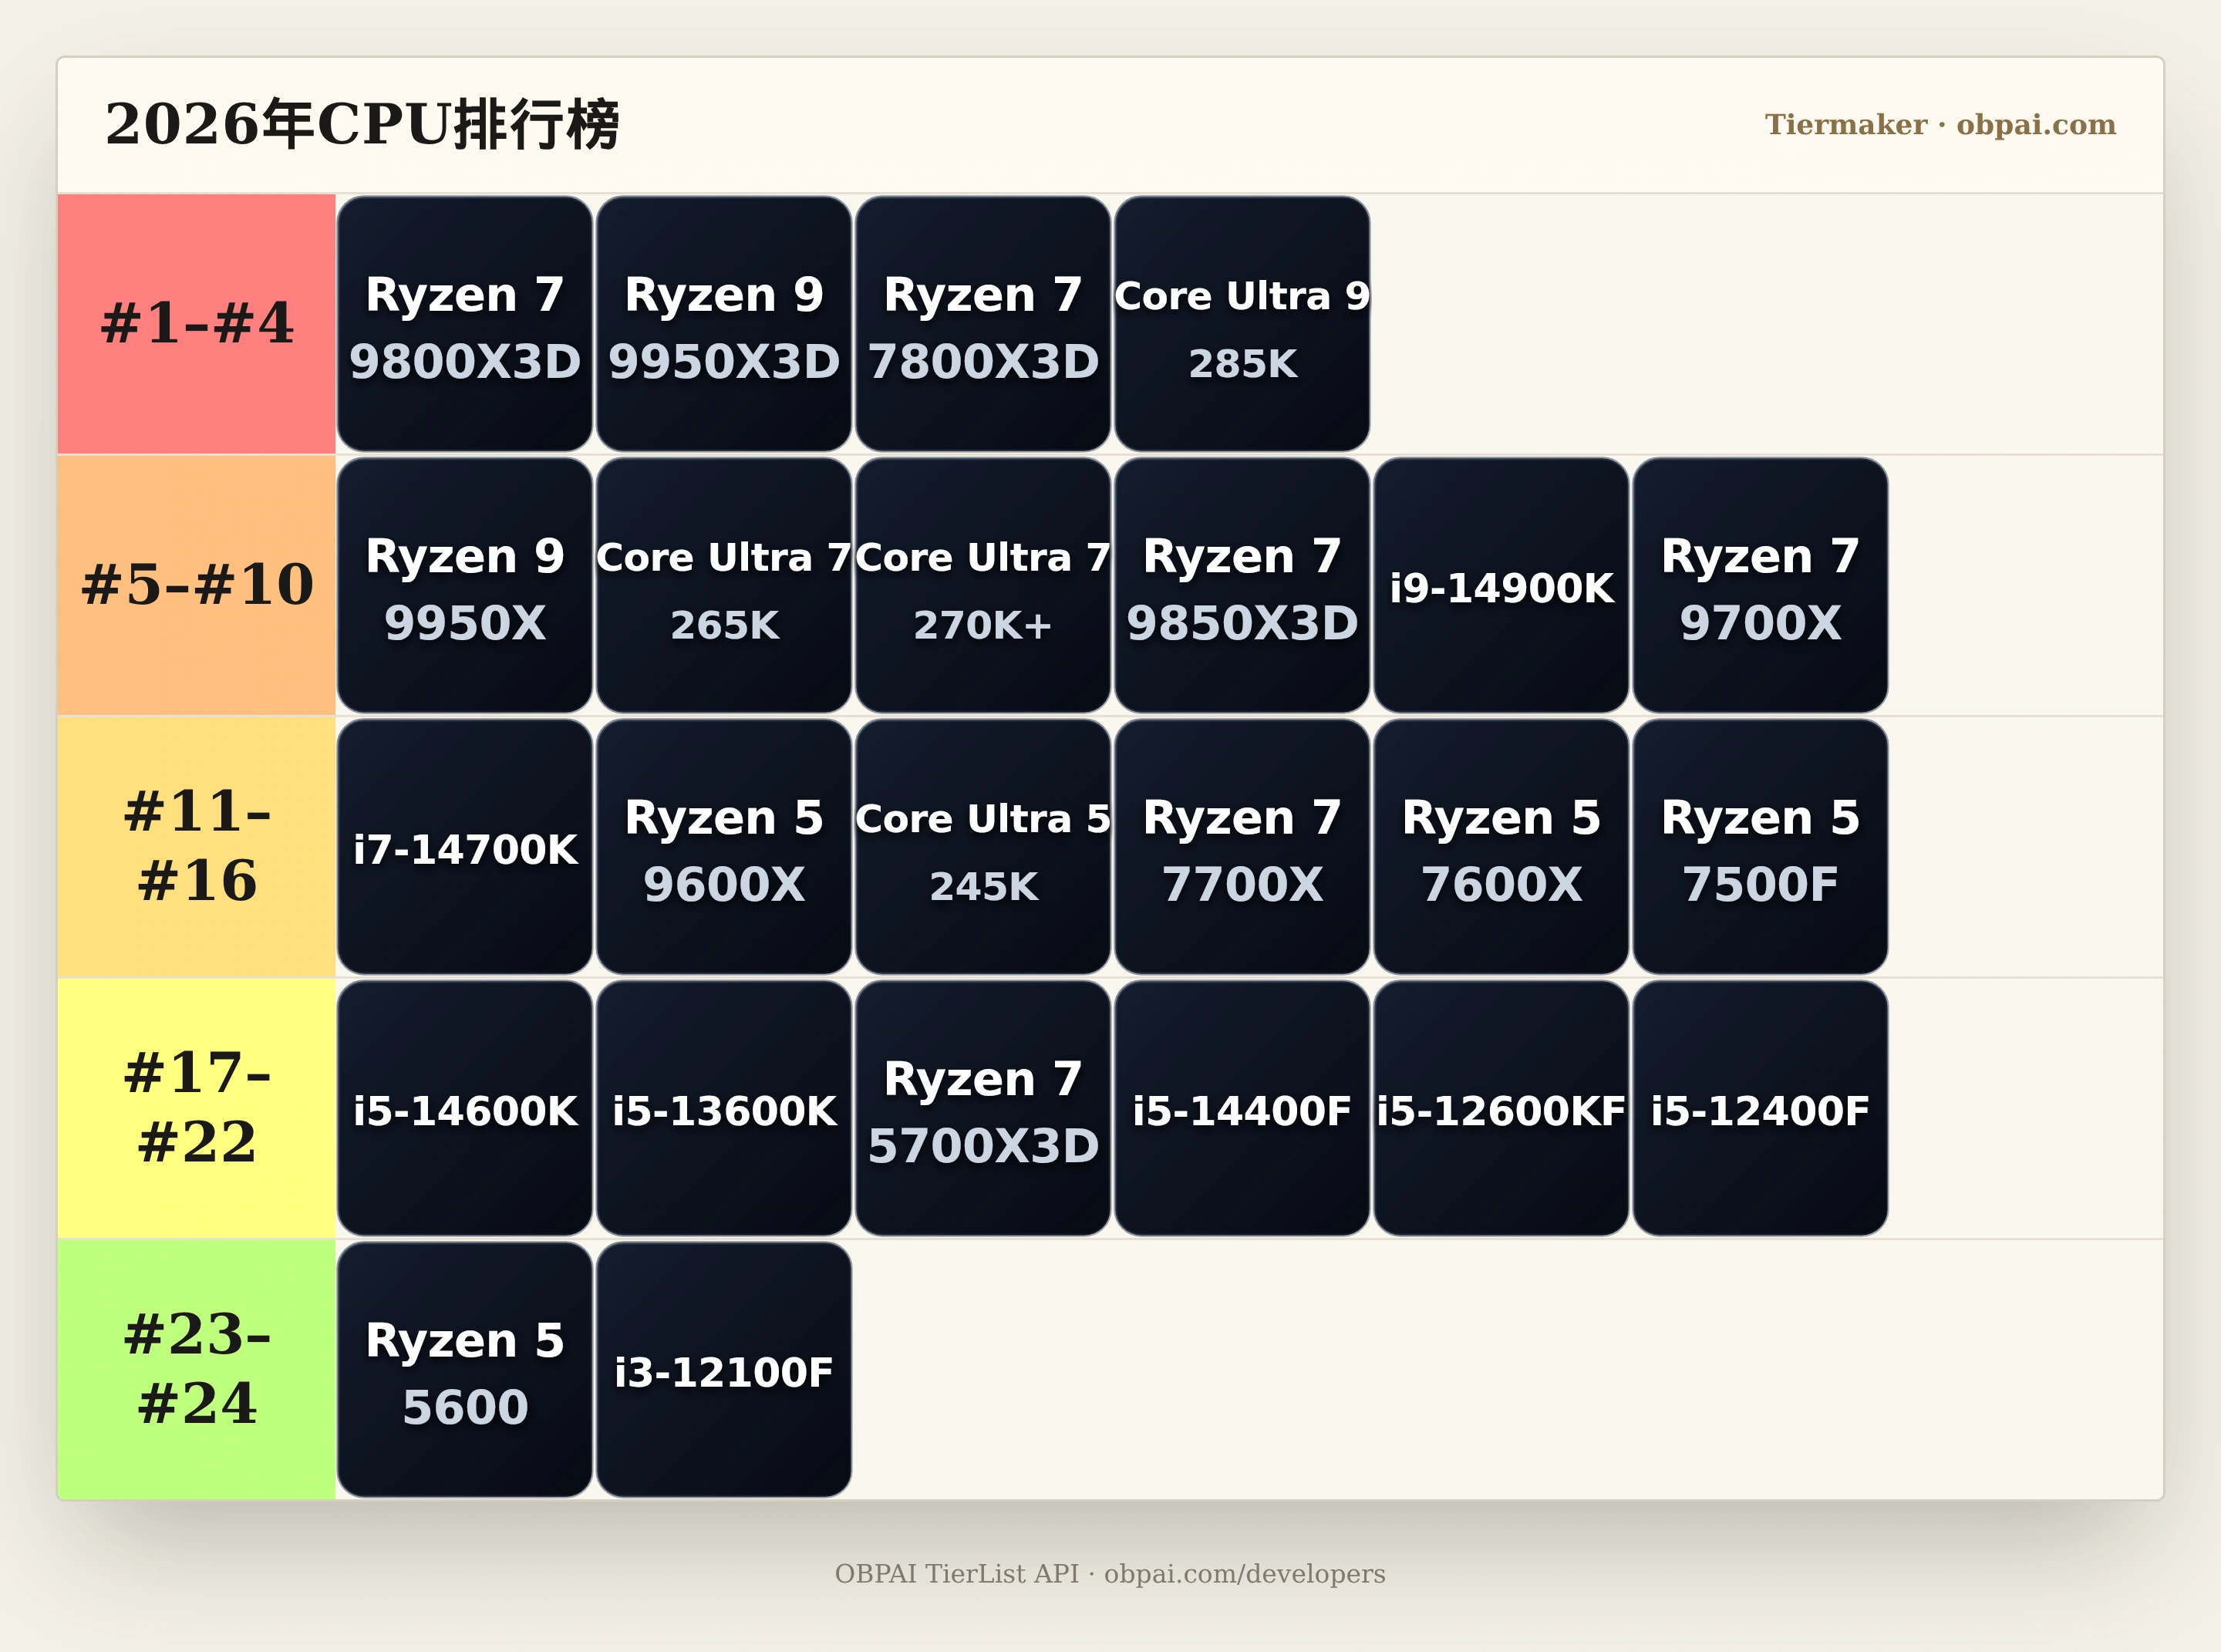
The template below lists entries for the models that keep appearing above; drag them into the S or A tier based on your own price point and use case. For the GPU side, seeGPU rankings。
互动体验:拖拽排位《CPU Tier List》
CPU Tier List
想打造自己的个性化天梯图并开放给读者嵌入吗?