
US National Parks Rankings 2026
As of 2026-09-18. NPS 2025 designated National Parks by recreation visits: Great Smoky Mountains 11,527,939 1st, Zion 2nd, Yellowstone 3rd. System total 323,014,305.

As of 18 September 2026. The main table ranks designated U.S. National Parks by 2025 recreation visits. The National Park Service posted the figures on 13 March 2026. Great Smoky Mountains is 1st at 11,527,939 visits; Zion 2nd; Yellowstone 3rd. Across 406 reporting units the system logged 323,014,305 visits. Country overnight arrivals: most visited countries. Attraction reputation: global attractions.
Designated National Parks, 2025, first 25
Recreation visits. Great Smoky Mountains drew more than twice as many visits as Zion. Yosemite is 5th. Rocky Mountain is 6th. Glacier is 10th. New River Gorge, which illustrated the news release, is 17th and set a park visitation record in 2025.
| # | Park | State | 2025 recreation visits |
|---|---|---|---|
| 1 | Great Smoky Mountains | N.C. / Tenn. | 11,527,939 |
| 2 | Zion | Utah | 4,984,525 |
| 3 | Yellowstone | Wyo. / Mont. / Idaho | 4,762,988 |
| 4 | Grand Canyon | Arizona | 4,430,653 |
| 5 | Yosemite | California | 4,278,413 |
| 6 | Rocky Mountain | Colorado | 4,171,431 |
| 7 | Acadia | Maine | 4,079,318 |
| 8 | Grand Teton | Wyoming | 3,800,648 |
| 9 | Olympic | Washington | 3,584,187 |
| 10 | Glacier | Montana | 3,136,557 |
| 11 | Cuyahoga Valley | Ohio | 3,025,325 |
| 12 | Joshua Tree | California | 2,932,644 |
| 13 | Indiana Dunes | Indiana | 2,629,497 |
| 14 | Hot Springs | Arkansas | 2,494,611 |
| 15 | Gateway Arch | Missouri | 2,209,028 |
| 16 | Bryce Canyon | Utah | 1,967,367 |
| 17 | New River Gorge | West Virginia | 1,958,440 |
| 18 | Hawaii Volcanoes | Hawaii | 1,877,854 |
| 19 | Shenandoah | Virginia | 1,682,152 |
| 20 | Mount Rainier | Washington | 1,635,342 |
| 21 | Arches | Utah | 1,511,740 |
| 22 | Capitol Reef | Utah | 1,388,476 |
| 23 | Sequoia | California | 1,378,337 |
| 24 | Death Valley | Calif. / Nev. | 1,320,134 |
| 25 | Redwood | California | 1,202,480 |
How this list is ranked
As of 2026-09-18. The main table ranks designated National Parks by 2025 recreation visits. The NPS news release of 13 March 2026 supplies ranks 1–10. Ranks 11–63 come from Public Lands Data, which compiles NPS IRMA Stats; its top 10 matches the release line for line. The 406 reporting units in the full system logged 323,014,305 visits; Blue Ridge Parkway, Golden Gate NRA and the rest of that list sit in the all-sites table below. Attraction reputation: global attractions.
| Source | Snapshot | Scope | Weight |
|---|---|---|---|
| NPS news release, 13 Mar 2026 | Published 13 Mar 2026; page updated 20 Mar 2026; this page 2026-09-18 | 2025 recreation visits; National Park top 10; all-sites top 10; 323,014,305 visits, 13,016,577 overnight stays, 26 record parks | Primary |
| Public Lands Data 2025 63-park ranking / IRMA Stats | 2026-09-18 | Designated parks 1–63; top 10 matches the release; 63-park total ~93.89 million | Primary (ranks 11–63) |
| WCNC, March 2026 | live news page | 2024 system ~331.9 million; 2025 about −2.7% / 8.85 million fewer; overnight −2.4% | Secondary (year-on-year) |
| NPS Visitor Use Dashboard | 2026-09-18 | Annual series by park; designated National Parks ~29% of system visits | Secondary |
All NPS sites, 2025, first 10
Same release. Blue Ridge Parkway is 1st at 16,533,753 visits. Golden Gate National Recreation Area is 2nd. Great Smoky Mountains is 3rd on this list. Lincoln Memorial is 5th. Parkways, recreation areas, seashores and trails are NPS units.
| # | Site | 2025 recreation visits |
|---|---|---|
| 1 | Blue Ridge Parkway | 16,533,753 |
| 2 | Golden Gate NRA | 15,748,676 |
| 3 | Great Smoky Mountains NP | 11,527,939 |
| 4 | Natchez Trace Parkway | 7,994,783 |
| 5 | Lincoln Memorial | 7,743,295 |
| 6 | Gateway NRA | 7,696,939 |
| 7 | Gulf Islands NS | 7,576,923 |
| 8 | George Washington Memorial Parkway | 6,732,932 |
| 9 | Appalachian NST | 6,215,118 |
| 10 | Lake Mead NRA | 6,135,586 |
Designated parks, ranks 26–40
Same 63-park ranking. Badlands is 26th. Denali is 39th. Ranks 41–63 sit in the candidate pool, including Gates of the Arctic and Kobuk Valley.
| # | Park | State | 2025 recreation visits |
|---|---|---|---|
| 26 | Badlands | South Dakota | 1,139,361 |
| 27 | Haleakala | Hawaii | 853,711 |
| 28 | Saguaro | Arizona | 847,749 |
| 29 | Canyonlands | Utah | 796,057 |
| 30 | Kings Canyon | California | 779,791 |
| 31 | Everglades | Florida | 778,198 |
| 32 | Glacier Bay | Alaska | 740,044 |
| 33 | Theodore Roosevelt | North Dakota | 729,893 |
| 34 | Mammoth Cave | Kentucky | 660,734 |
| 35 | White Sands | New Mexico | 659,742 |
| 36 | Crater Lake | Oregon | 632,242 |
| 37 | Wind Cave | South Dakota | 606,258 |
| 38 | Big Bend | Texas | 568,104 |
| 39 | Denali | Alaska | 543,300 |
| 40 | Lassen Volcanic | California | 504,777 |
WCNC, citing the Service: the system recorded about 331.9 million visits in 2024; 2025 was roughly 2.7% lower, about 8.85 million fewer, with overnight stays down 2.4%. The release notes a 43-day partial government shutdown, during which the Service kept parks open when it could. China high-grade scenic areas: 5A sites. City volumes: global travel cities. Destination reputation: Tripadvisor destinations. Theme parks: global theme parks.
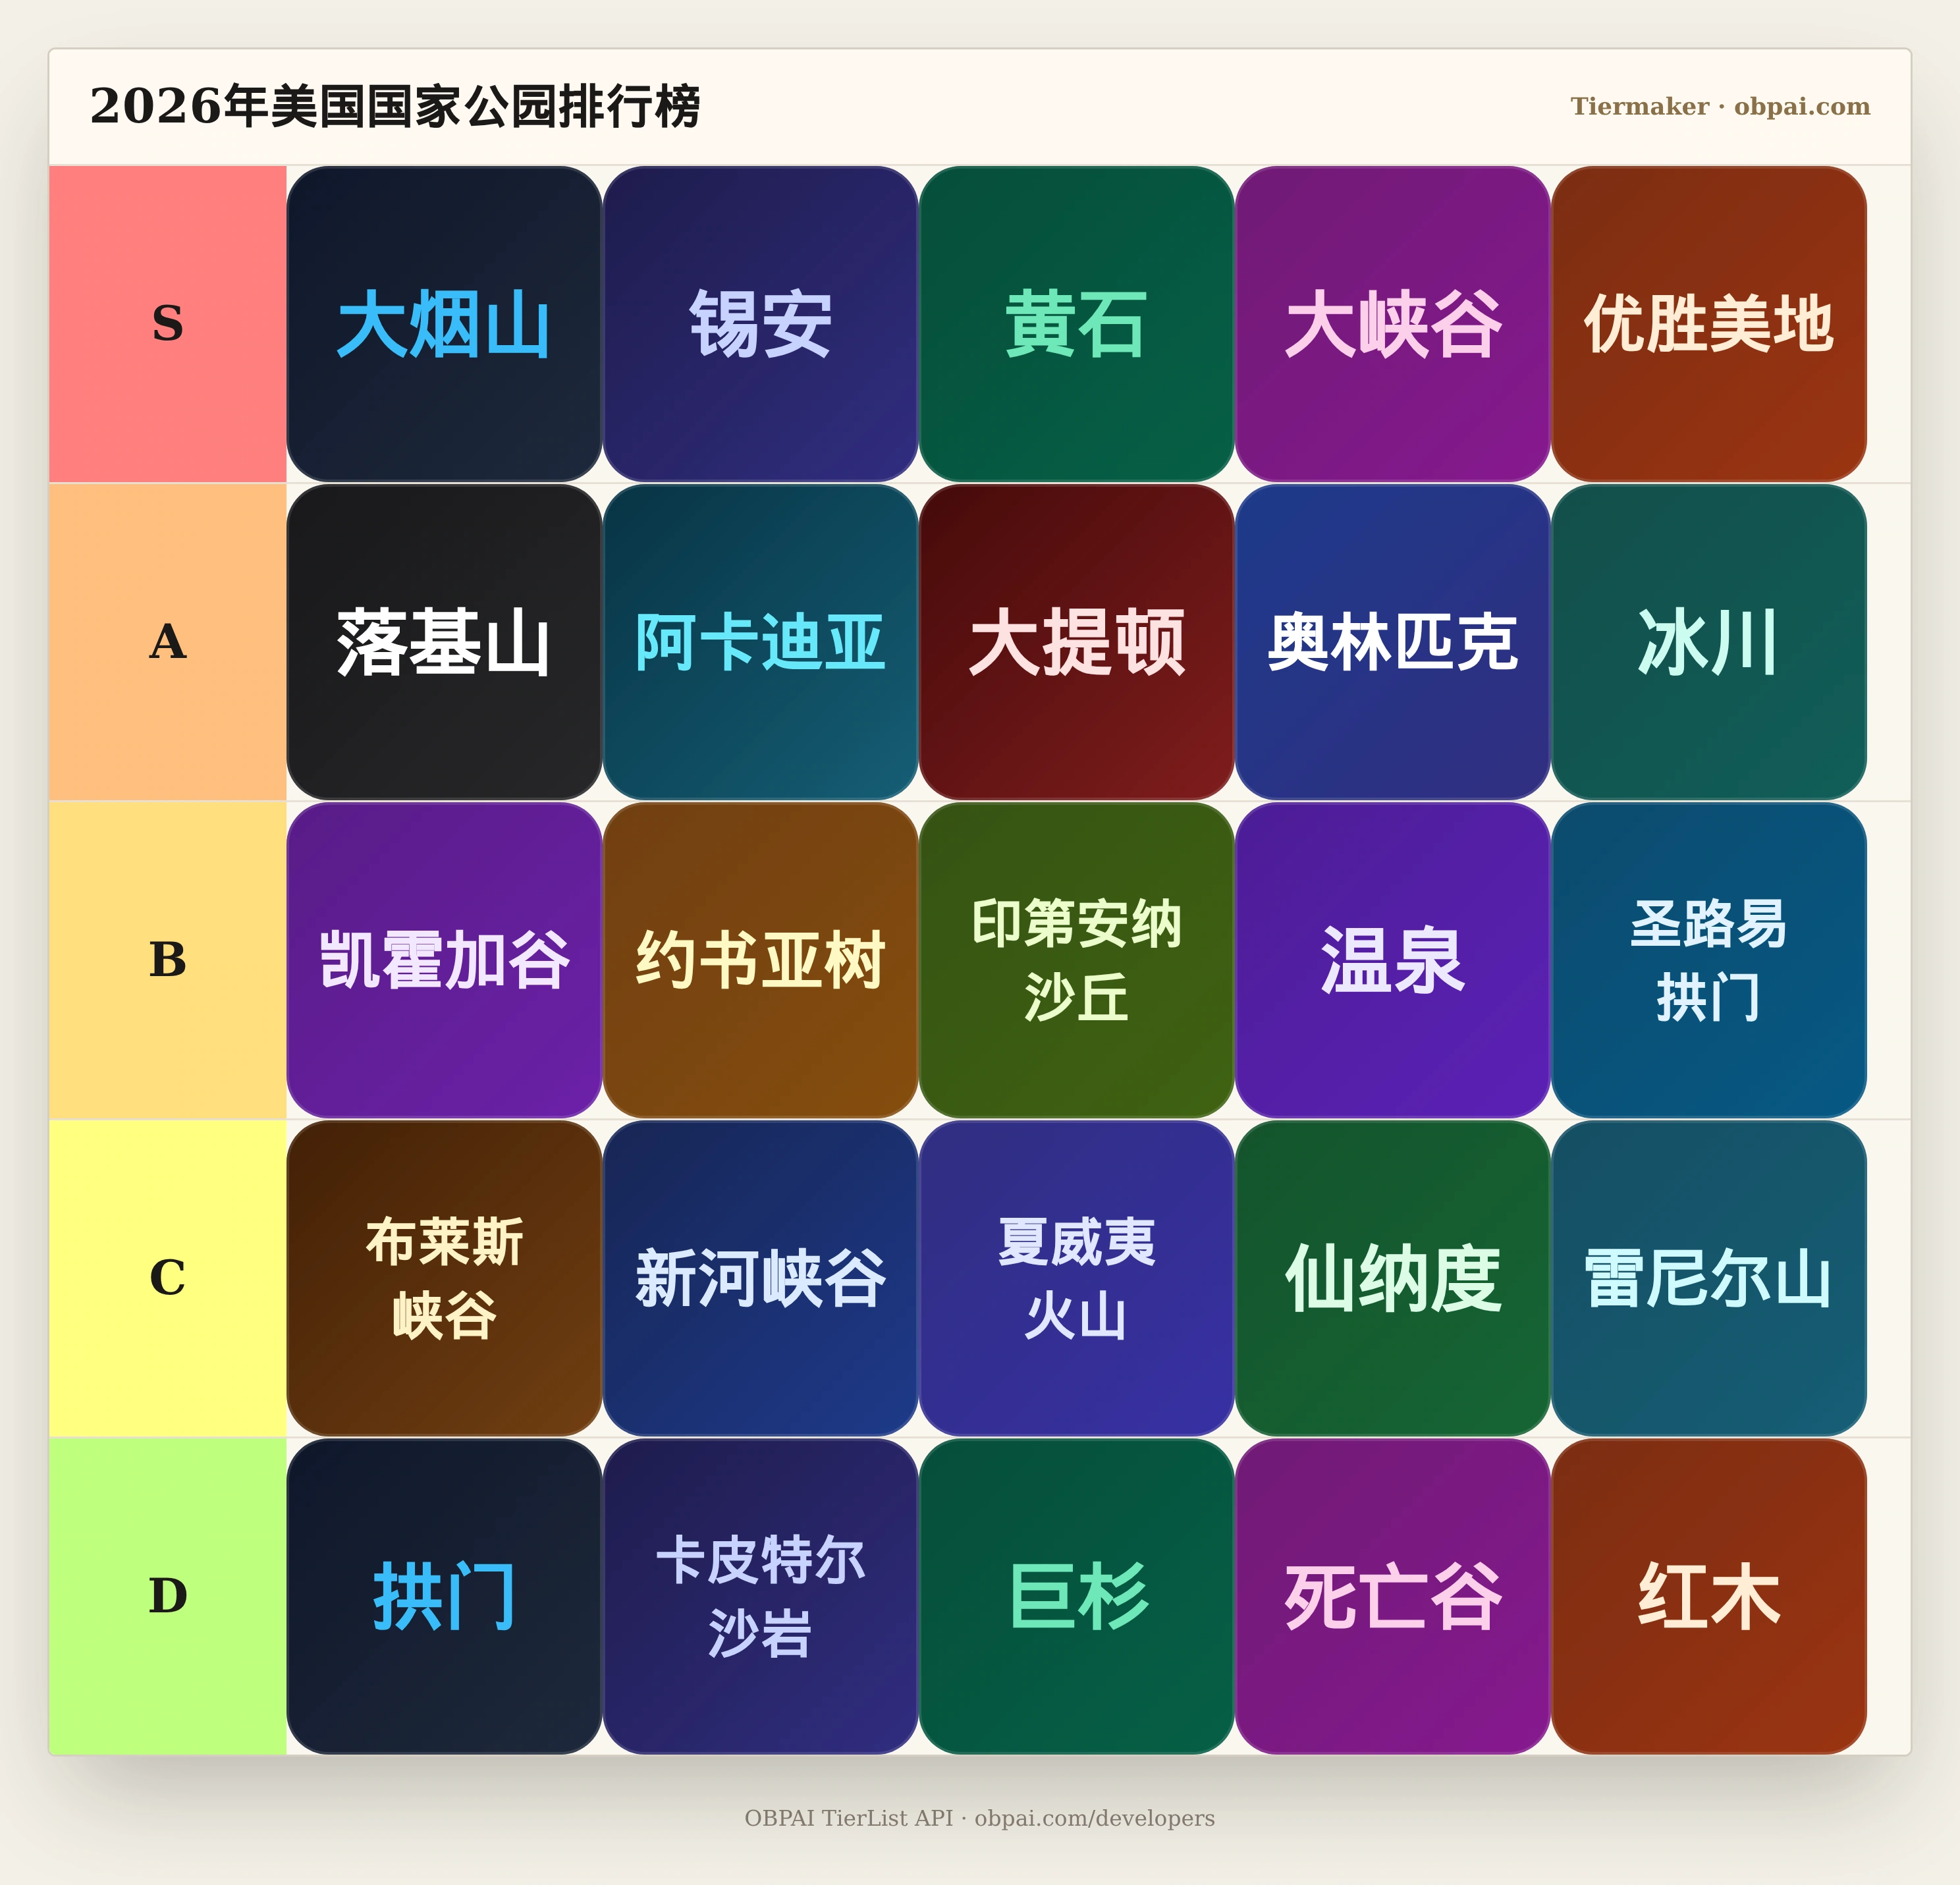
互动体验:拖拽排位《US National Parks Tier List 2026》
US National Parks Tier List 2026
想打造自己的个性化天梯图并开放给读者嵌入吗?